Hi there, this is Chris from the Witan project, sharing some updates on the new city platform we’ve been building over the last few months.
Presenting Witan at the GLA Population Statistics User Group
Earlier in January, we made Witan available to London’s boroughs, so staff in local authorities could start creating demographic projections, using GLA’s methodology. And on the 23rd of that month, we had a chance to demo Witan to the Population Statistics User Group, in City Hall, and hang out to troubleshoot with users.
We had some really useful feedback and feature requests come out of it, so if you spoke to any of the Witan team there, thanks for your help!
Here’s a few of the ideas that kept coming back in conversations we had there:
- breaking down projections by sex
- showing the differences between different projections on the same screen
- visualising the output of projections in the app, as charts or on a map
Do these sound about right to you?
Witan is new and far from complete, so if there’s something you wish you could do with it when using projections, let us know, as this informs our roadmap of new features to build over the coming months.
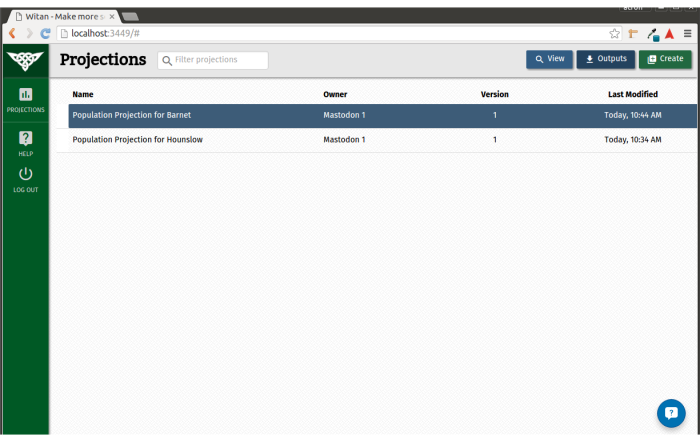
A new look for Witan
Also, if you’ve used Witan in the last week, you might notice an updated design when you sign in. Witan now looks like this once you’ve logged in:

When testing the original design, we noticed a few recurring issues with users:
- users struggled with using the site on smaller screens
having just icons made it hard to tell what buttons did before you pressed them
the design didn’t have a clear place for adding new functionality beyond making projections
we were showing some data that was only used internally, which confused and distracted users when trying Witan out for the first time
So, we’re trying out a new design to address some of these issues – this is available now, (although you might need to refresh your browser’s cache to see it). The updated guide for using Witan is also online here
Office hours
We’re still keeping a limited set of office hours, so if you’d like a demo of Witan, or run through when using it for the first time, you can book a 30 minutes slot at the link below:
As before, you can request help anytime inside the app, using the help icon in the bottom right, or by emailing witan@mastodonc.com.
Opening up access and future development
Witan should now be available to all the London boroughs – so if you work for the GLA, or any of the London boroughs and use demographic projections in your work, you can request an invite at witan@mastodonc.com – we usually either create an account for you the same day, or let you know when we’re sending our next bunch of invites out to users.
Future updates to Witan
Over the coming weeks, we’ll be making various tweaks to Witan, and extending the functionality of the platform – we’ll be working on making economic models available, sharing in groups, and allowing users to visualise outputs generated by Witan in the application itself.
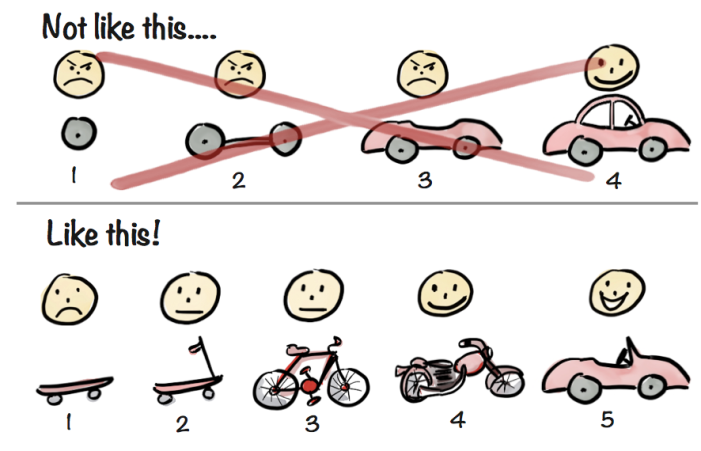
We use an iterative process though, which involves testing new features with users incrementally – building a minimal version first and getting feedback, then evolving it over time. We’ve found the diagram below useful for communicating this process before:
Over the next two weeks, we’re recruiting a set of beta testers to show some of these initial designs by to get early feedback, before we build them, so if you’d like to be part of this group , you can do so by dropping us an email saying ‘I’d like to be a beta tester’.
That’s it for now
Our next bulletin ought to be in March, but if you have a burning questions about Witan, or any comments about your experiences of using it so far, you can reach us at witan@mastodonc.com. Til then!
