Using Witan data in Section 106 contribution agreements

Have you been involved in preparing an evidence base for determining Section 106 contributions for a new development project in your borough recently? If so, we’d like to talk to you.

We’re currently looking for people in local government to talk to, so we can learn about the process, as we think it might be possible to use Witan to generate demographic projections on demand, to inform Section 106 related decisions.

Our current thinking is that may be possible to quickly re-run projections in response to uplifts in the number and kinds of units going into a new developments. However, we’d like to speak to people with experience in this, to see how plausible this is.

If you might have 30 minutes to talk about this over the next few weeks, we’d love to talk to you about this.

You can book a call at a time convenient to you using the form listed at the link below:

https://calendly.com/mastodonc-chris

If you’re unable to use the form, you can also respond by sending an email to witan@mastodonc.com


How Witan and the SRP work together

This year, if you use the GLA’s School Roll Projection service, you’ll need to use Witan to generate one of two files to send along to the GLA to run your School Roll Projections. This post outlines how they work together.

A four step process

Witan and the SRP services (2)You can think of the process as a one made of the following steps:

  1. Generate population projection using Witan
  2. Download correct output file
  3. Send completed School Roll template and population projection file from Witan
  4. Receive School Roll projections

1. Generate projections with Witan

If you’re new to Witan, or it’s been a while since you last used it, we’ve compiled some handy links to help bring you up to speed again.

This post here provides some more details, with step by step instructions and video.

If you’re not sure which model to use, or which options, this post outlines the recommended options and provides some helpful details.

2. Download the correct output file

For the SRP you’ll need to download the Ward Population Split Gender output file from Witan. This post describing how files are named explains some more about what the different outputs mean, and how to read the filenames when downloading the files.

3. Send population and school roll files

If you’re using the School Roll Projections Service, you need to send along this population projection file, along with a completed School Roll file based one of two templates shared with you previously by the GLA.

4. Receive School Roll projections from the GLA

Once the modelling has run, your School Roll projections will be provided by the GLA, at Borough level, Planning area level, and at School level.

Getting help

If you need help with steps 1 and 2 (i.e generating population projections, and downloading the correct output files), you can send a message within Witan, or send an email to witan@mastodonc.com to get through to the support team.

If you need help with steps 3 and 4, you can still contact witan@mastodonc.com, but you may receive the help you need faster by contacting the GLA directly at demography@london.gov.uk.


Understanding projection filenames with Witan

After generating a demographic projection with Witan, if you click the output tab in front of you, you’ll see a list of possible files to download. This post here explains how to make sense of the filenames, to get an idea of the assumptions in the output.

Seeing the possible outputs from a projection

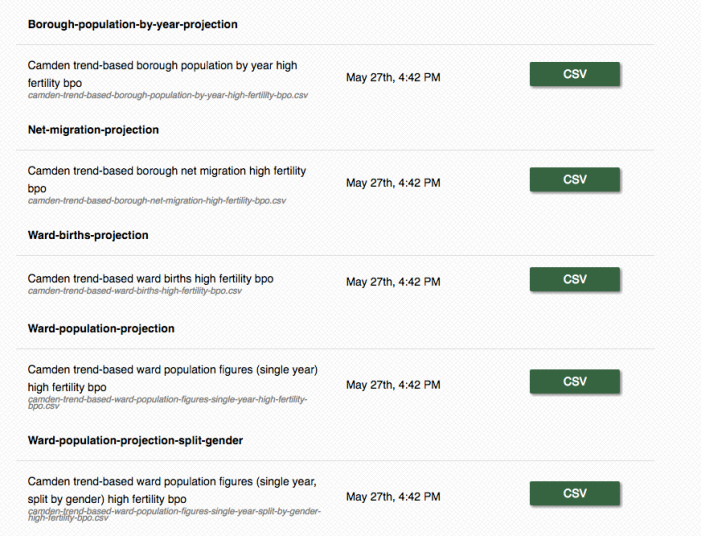
When you generate  a projection, Witan generates a number of different output files – with each with slightly different intended uses. Right now, the only option is to download csv files, but further down the line more options will be available.

Screen Shot 2016-06-06 at 12.15.51

How the files are named

How to read the filenames from witan

You’ll also notice how the files are named. In future, each dataset will have a link back to the projection where you can see all the assumptions that went into it, but in the meantime, some of this information is written in into the filename.

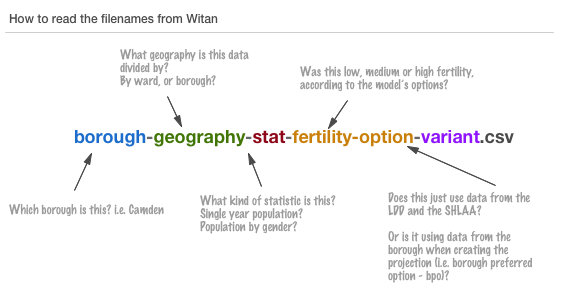
You can think of the name as following the naming convention below

$borough-$model-$geography-$stat-$fertility-option-$variant.csv

In this case the the $borough refers to the which london borough this projection is for, and the  $model relates to the kind of model used to generate the projection (this might be purely trend-based, or use the expected developments as a factor in). The $geography refers to the granularity of the projection (is this by ward, or across the entire borough?). The $stat explains what the numbers are showing (are they split by gender? by year? etc.). The $fertility-option covers the scenario used by this model, to account for differing expected birth rates for in a borough, and finally the $variant refers to whether this projection is using only data from the GLA (the London Development Database and the SHLAA), or if it’s using numbers also uploaded by the borough itself when generating the projection.

Some examples

camden-trend-based-borough-population-by-year-high-fertility-bpo.csv
borough Camden
model Trend based
geography borough
stat Population by year
fertility option High fertility
variant bpo (borough preferred option)
camden-trend-based-ward-population-figures-single-year-high-fertility-bpo.csv
borough Camden
model Trend based
geography ward
stat Population single year
fertility High fertility
Borough data used? bpo
camden-trend-based-ward-population-figures-single-year-split-by-gender-high-fertility-bpo.csv
borough Camden
model Trend based
geography ward
stat Population single year split by gender
fertility High fertility
Borough data used? bpo

Getting more help

As ever, if you have further questions, you can always drop an line via email witan@mastodonc.com, or hit the blue question mark in the bottom right of the screen when using Witan – it’ll put you through to the support team, who’ll help you answer any queries you have.
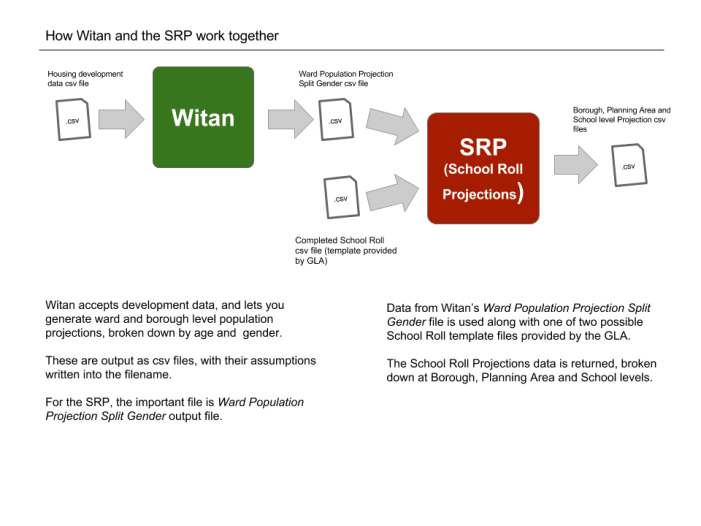