Using Witan data in Section 106 contribution agreements

Have you been involved in preparing an evidence base for determining Section 106 contributions for a new development project in your borough recently? If so, we’d like to talk to you.

We’re currently looking for people in local government to talk to, so we can learn about the process, as we think it might be possible to use Witan to generate demographic projections on demand, to inform Section 106 related decisions.

Our current thinking is that may be possible to quickly re-run projections in response to uplifts in the number and kinds of units going into a new developments. However, we’d like to speak to people with experience in this, to see how plausible this is.

If you might have 30 minutes to talk about this over the next few weeks, we’d love to talk to you about this.

You can book a call at a time convenient to you using the form listed at the link below:

https://calendly.com/mastodonc-chris

If you’re unable to use the form, you can also respond by sending an email to witan@mastodonc.com


How Witan and the SRP work together

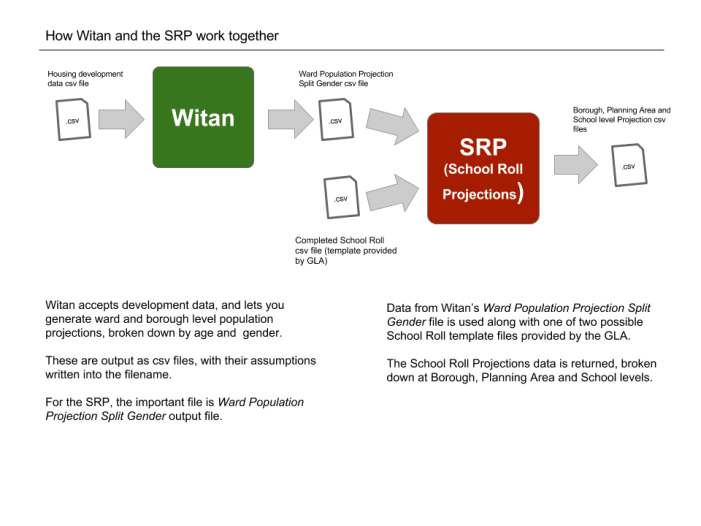
This year, if you use the GLA’s School Roll Projection service, you’ll need to use Witan to generate one of two files to send along to the GLA to run your School Roll Projections. This post outlines how they work together.

A four step process

Witan and the SRP services (2)You can think of the process as a one made of the following steps:
  1. Generate population projection using Witan
  2. Download correct output file
  3. Send completed School Roll template and population projection file from Witan
  4. Receive School Roll projections

1. Generate projections with Witan

If you’re new to Witan, or it’s been a while since you last used it, we’ve compiled some handy links to help bring you up to speed again.

This post here provides some more details, with step by step instructions and video.

If you’re not sure which model to use, or which options, this post outlines the recommended options and provides some helpful details.

2. Download the correct output file

For the SRP you’ll need to download the Ward Population Split Gender output file from Witan. This post describing how files are named explains some more about what the different outputs mean, and how to read the filenames when downloading the files.

3. Send population and school roll files

If you’re using the School Roll Projections Service, you need to send along this population projection file, along with a completed School Roll file based one of two templates shared with you previously by the GLA.

4. Receive School Roll projections from the GLA

Once the modelling has run, your School Roll projections will be provided by the GLA, at Borough level, Planning area level, and at School level.

Getting help

If you need help with steps 1 and 2 (i.e generating population projections, and downloading the correct output files), you can send a message within Witan, or send an email to witan@mastodonc.com to get through to the support team.

If you need help with steps 3 and 4, you can still contact witan@mastodonc.com, but you may receive the help you need faster by contacting the GLA directly at demography@london.gov.uk.


Understanding projection filenames with Witan

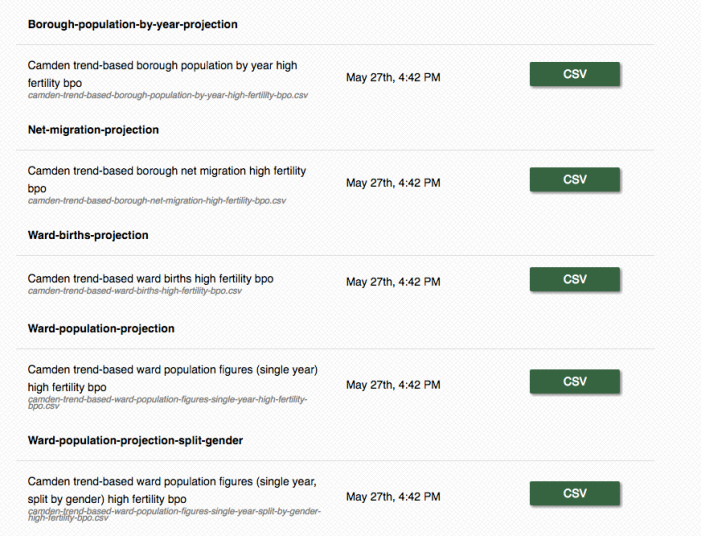
After generating a demographic projection with Witan, if you click the output tab in front of you, you’ll see a list of possible files to download. This post here explains how to make sense of the filenames, to get an idea of the assumptions in the output.

Seeing the possible outputs from a projection

When you generate  a projection, Witan generates a number of different output files – with each with slightly different intended uses. Right now, the only option is to download csv files, but further down the line more options will be available.

Screen Shot 2016-06-06 at 12.15.51

How the files are named

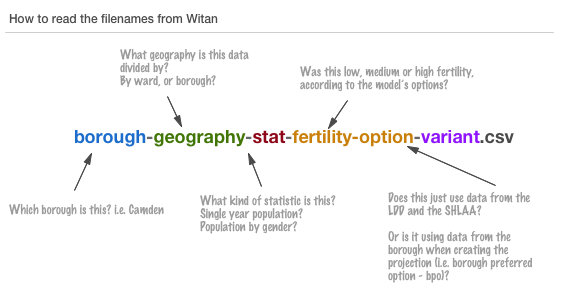
How to read the filenames from witan

You’ll also notice how the files are named. In future, each dataset will have a link back to the projection where you can see all the assumptions that went into it, but in the meantime, some of this information is written in into the filename.

You can think of the name as following the naming convention below

$borough-$model-$geography-$stat-$fertility-option-$variant.csv

In this case the the $borough refers to the which london borough this projection is for, and the  $model relates to the kind of model used to generate the projection (this might be purely trend-based, or use the expected developments as a factor in). The $geography refers to the granularity of the projection (is this by ward, or across the entire borough?). The $stat explains what the numbers are showing (are they split by gender? by year? etc.). The $fertility-option covers the scenario used by this model, to account for differing expected birth rates for in a borough, and finally the $variant refers to whether this projection is using only data from the GLA (the London Development Database and the SHLAA), or if it’s using numbers also uploaded by the borough itself when generating the projection.

Some examples

camden-trend-based-borough-population-by-year-high-fertility-bpo.csv
borough Camden
model Trend based
geography borough
stat Population by year
fertility option High fertility
variant bpo (borough preferred option)
camden-trend-based-ward-population-figures-single-year-high-fertility-bpo.csv
borough Camden
model Trend based
geography ward
stat Population single year
fertility High fertility
Borough data used? bpo
camden-trend-based-ward-population-figures-single-year-split-by-gender-high-fertility-bpo.csv
borough Camden
model Trend based
geography ward
stat Population single year split by gender
fertility High fertility
Borough data used? bpo

Getting more help

As ever, if you have further questions, you can always drop an line via email witan@mastodonc.com, or hit the blue question mark in the bottom right of the screen when using Witan – it’ll put you through to the support team, who’ll help you answer any queries you have.

Guidance from the GLA for choosing models in Witan to submit for the SRP

How do I produce a ‘standard’ set of population projections?

One hurdle that users have come across is that they weren’t sure how to set up the models to produce a standard set of outputs such as they would have received from the GLA.

The default options the GLA would generally recommend to use are the Housing-Linked model, the Capped Household Size variant and Standard Fertility fertility assumption (for more information on what these mean, have a look at this post). If in the past, you have found the ‘Alternate’ variant roll projections to be a better fit for your local authority, then using the Trend-based projection and the Standard Fertility setting will replicate this.

When uploading your development data in the template, the GLA would recommend making sure that data is included for all years, including estimated development for 2011-2014. If you don’t have alternative estimates for these years, the SHLAA template that can be downloaded from the system includes estimated completions from the London Development Database.

Who should run the population projections in Witan?

This is up to each authority to determine for themselves. However, the GLA expects and generally encourage nominated Demography contacts to take a lead on this activity.

  • If you are unclear who is the Demography contact in your local authority, please let the GLA know and they’ll be happy to confirm.
  • If you’d like to know who are registered users of the system, drop Mastodon C a line and they can tell you.
  • If you are the nominated contact for your authority, but don’t feel confident in producing projections in Witan, please either Mastodon C or GLA know and we’ll be happy to assist.

GLA contact: Demography@london.gov.uk

Mastodon C contact: witan@mastodonc.com

Can I get roll projections without providing population projections?

If you have provided roll data, but are still struggling to create your population projections, the GLA can now produce a set of roll projections for you using their publicly available SHLAA-based projections. They still recommend producing your own projections that incorporate your most up to date development assumptions.

The GLA London-wide SHLAA based 2015 projections are now online

When working with demographics data it’s worth knowing when new London-wide population projections are available online for you own analysis.

So, if you missed it, a number of variants of the GLA 2015 round population projections have now been published onto the London datastore.

You can find them at the link below:

http://data.london.gov.uk/dataset/2015-round-population-projections

Handy links for first time Witan users

If you haven’t used Witan before, you’d be forgiven for wondering how you’re supposed to use it when coming to it for the first time.

This is doubly the case if you’re using Witan to generate the Ward population projection split-gender dataset needed for using the GLA’s School Roll Projection (SRP) service.

So, we’ve compiled a few links to help you when doing this:

Video walkthrough

Below is a 5 minute video walkthrough of using Witan for the first time, from signing in to generating a population projection for the SRP.


Step by step instructions with screenshots

If you prefer reading text and seeing screenshots instead of watching videos, we’ve put together a step by step guide at the link below

https://github.com/MastodonC/witan.docs/blob/master/GUIDE.md

Guidance on using different models inside Witan

If you’re not sure what the options mean when setting up a model to generate projections, we’ve published some guidance on what they mean below:

https://witanbulletin.wordpress.com/2016/03/21/a-brief-guide-to-choosing-your-models-in-witan/

SRP guidance from the GLA

If you’re not quite sure which model to choose, here is some guidance from the GLA:

https://witanbulletin.wordpress.com/2016/05/31/guidance-from-the-gla-on-choosing-models-for-the-srp-using-witan/

Getting extra help

If anything isn’t obvious to you, you can always ask for help when using Witan by either emailing witan@mastodonc.com, or clicking the blue circle with a question mark in the bottom right of the screen – this will put you straight through to the support team, who can help you answer any questions you have.


Births by ward in your projection output

A few Witan users have been asking about having births in the generated output when creating a projection on Witan.

This is not needed for the school roll projections, just a further output that may be useful when deciding what projections to use.

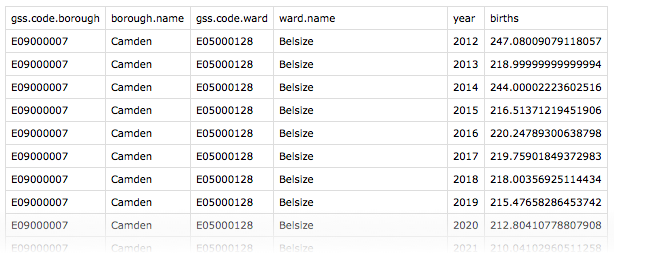
I’m pleased to say this is now available with every projection generated – when running a new projection there will now be a new file to download, giving you some output a bit like this:

Faded Data Showing Wards

How to get it

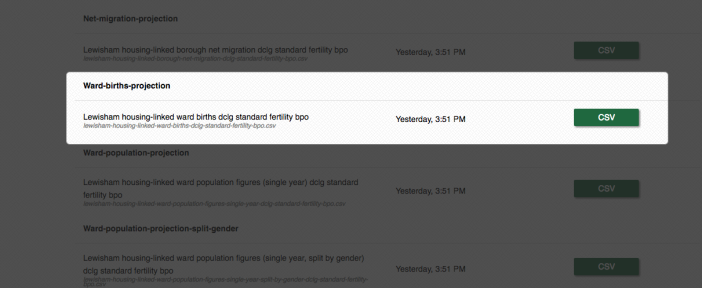
When you generate a projection on Witan there will be a new file available to download among your other files:

Births by Ward.png

For old projections

If the last time you generated a projection was more than a few days ago, you’ll need to generate a new version of your projection, to see the new data file.

The fastest way to do this is to find the last input file you have, download it, then re-upload as a new file.

When you next generate the file, you’ll have your births by ward file there to download.

Let us know how you get on!


Witan Bulletin 8 – the SRP edition

Hello, this is Sunny Townsend and Chris Adams at Mastodon C, with a few updates on the Witan project.

The SRP is now ready for you to use

Recently, the GLA completed work on the new version of the School Role Projection model, and if you have generated a population projection using Witan, you can now submit it to the GLA, and they will generate a projection of school places for you.

We’ve put together a short video providing a step by step guide on how to use Witan to generate this projection file for the SRP:


If you need to create a zero-development scenario, or want more detail on using Witan we have some more detail and helpful links on the Witan Bulletin blog, as well as some new in-app help.

If you’d like some more guidance on the best model to use or on referencing your projections, we have a short guide on choosing the model for your projection here too.

Office hours

We’re also still offering limited office hours support for those using Witan for the first time and would like an introduction. You can book a 30 minute slot for a run through over the phone, or using screen sharing software, at the link below:

Book a an intro session to Witan

Extending models in Witan without writing code

At Mastodon C, we’re conducting some research into building a visual, no-code environment to allow users of Witan to adjust existing models, or author their own models entirely. We’re looking for participants from the London boroughs to help with the research.

This will involve a call or screen sharing session, where we will share link to prototype we’ve been working on, and ask for your feedback on using some of the features.

If you’d like to take part, please follow the link below and book a 30 minute session:

Book a session

That’s all for now!

Hope that helped – the next bulletin will be in May, so until then have a good bank holiday!


Using Witan to generate projections to use with the SRP

One of the most common initial use cases for Witan is generating projections that are suitable for use with the GLA’s School Role Projection service. This post gives a short outline on how to do so.

If you prefer to watch a 5 minute video:

We’ve put together a short video showing from signing into Witan to downloading a suitable file. Enjoy!


Okay, I have my population projection file, now what?

Once you have your population projection file broken down by gender, you’re ready to send this to your contact at the GLA.

Some information about your projection is encoded in the filename like so: camden-housing-linked-ward-population-figures-single-year-dclg-standard-fertility-bpo.csv.

You can send the file unchanged, or rename it when sending it along – it’s up to you, but when referring back, it’s useful to make a note of this this information when sending it, to refer back later.

Creating a zero dev scenario

There may be cases where you want to make a projection with no future development of housing is assumed.

The easiest way to do this is download either of the template files for your borough, and reset all the cells to 0.

If you don’t explicitly mark a cell with zero, the model Witan runs will add data from the SHLAA by default.

If you need more details

We also have a user guide for Witan online, and as ever you can always get in touch with queries at witan@mastodonc.com.


A brief guide to choosing your models in Witan

With Witan, you can create population projections by feeding development data into a model, to get some output you can reuse for your own analysis. However, which model should you use? Below, Ben Corr, the GLA’s head demographer, describes when you might use one model over another, and explains some of the other options available to you:

All projections use a common ‘ward model’ to distribute borough-level population between wards.  The ward model is based on cohort component methodology.  Annual migration estimates are not available at this geographic level, so proxy flows are generated based on the housing trajectory and census data.  The impact of development in a particular ward is dependent upon the characteristics of migrants to and from the ward and the historic ratio of adults per dwelling.

Trend-based Ward Population Projection Model

This model uses projections of the overall borough-level population from the GLA’s trend-based cohort-component model.  The overall population is independent of the assumed housing trajectory.  Ward level projections are constrained to match the overall borough-level population, but the distribution of population between the wards is determined by the housing data input by the user.

This model is most useful in areas where recent population change has occurred largely independently of changes in available housing stock.  In areas where recent population growth outstrips planned housing development, the model results will imply increasing household size.

Housing linked Ward Population Projection Model

Two variants of model are available to produce population projections linked to the user’s chosen housing trajectory.  They differ in how borough-level populations are generated, both use the ward model to distribute these between wards.

DCLG variant

This model adjusts domestic migration assumptions until it arrives at a borough-level population that fits the available dwelling stock.  The model’s name derives from the use of relationships from DCLG’s household projections to convert a candidate population into a number of households.  The model estimates the capacity for households based on the housing trajectory input by the user and the historic relationship between households and dwellings.

This model is useful in areas where housing development is expected to be the predominant driver in future population change.  Projections produced by this model will usually imply falling household size.  This results from an increasing proportion of older people in the population and an assumption that older people tend to form smaller households.

Capped Household Size variant

This model attempts to account for both recent trends in population change and future changes in housing stock.

It operates on the following principles: if housing capacity is increasing faster than recent population growth, then housing drives growth as it does in the DCLG-based model;

if recent trends imply growth above available capacity, population growth is limited by available housing stock though average household sizes do not fall as they would in the DCLG-based model.  Average household sizes are prevented from rising above recent levels.

This is the GLA’s general use model and provides more intuitive results across a wider range of scenarios than either the trend-based model or DCLG variant of the housing linked model.

Which fertility assumption?

The models are initiated with fertility rates for each borough and ward based on recent birth estimates.  These are then projected forward using trends taken from the 2014-based National Population projections for England.  The Low, Standard, and High options correspond to the trends from the Low, Principal, and High fertility variants of the national projections.

  • Standard – fertility relative to 2014 rises by 4% over the next decade before levelling off
  • Low – fertility relative to 2014 falls by 6.5% over the next decade before levelling off.
  • High – fertility relative to 2014 rises by 13% over the next decade and then rises at a slower rate to reach a level 15% higher by 2040.

Further questions

If you have further questions when using Witan to generate projections, you can always send an email to witan@mastodonc.com, or use the in-app help system to speak to the support team  – just click the blue speech bubble in the bottom right of any screen when logged in.